State of Our Air
Particulate Matter
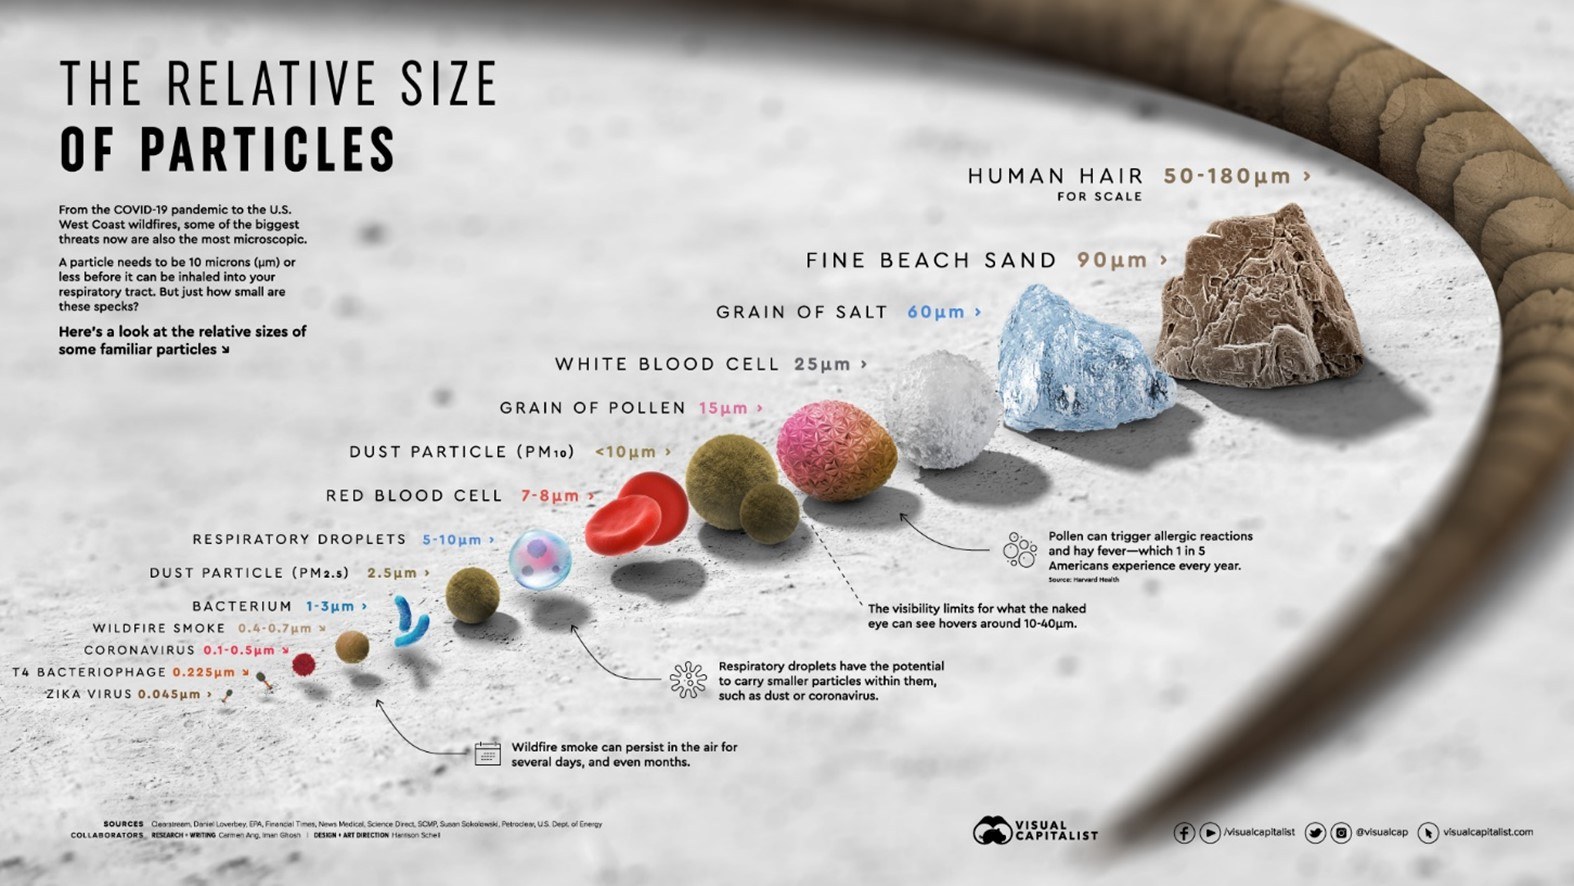
Particulate matter (PM) comprises of small particles or liquid droplets in the air. PM10 consists of coarse particles with a diameter of 10 μm or less and PM2.5 consists of fine particles of 2.5 μm or less. Generally speaking, PM10 is a primary pollutant and PM2.5 is more likely to have formed from secondary processes when gases emitted from motor vehicles and industries undergo chemical reactions in the atmosphere. Data collected during monitoring of PM10 levels also includes measurements for PM2.5. There are also monitoring stations specifically for measuring levels of PM2.5.
Particulate pollution includes dust, smoke, soot, salt, acids and metals. Levels of particulate matter are influenced by emissions from a range of sources, including transport, domestic solid fuel (wood) heaters, bushfires, industry, commercial activity, agriculture, forestry, mining, the use of energy and resources, and oceanic processes (sea spray). Ambient particles are the most significant air-quality–related risk to human health, especially in urban areas. The smaller the particles, the easier they are to inhale into the lungs and the more significant the impact on human health. Increasing population and higher-density living are putting pressure on our ability to manage ambient particle levels and reduce community exposure. Climate change is another pressure, with predictions of more frequent extreme events likely to result in further exposure to particles in dust and smoke.
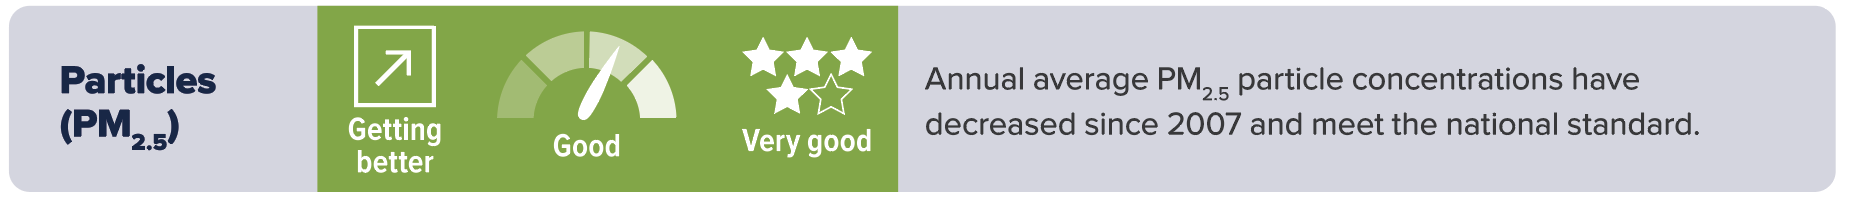
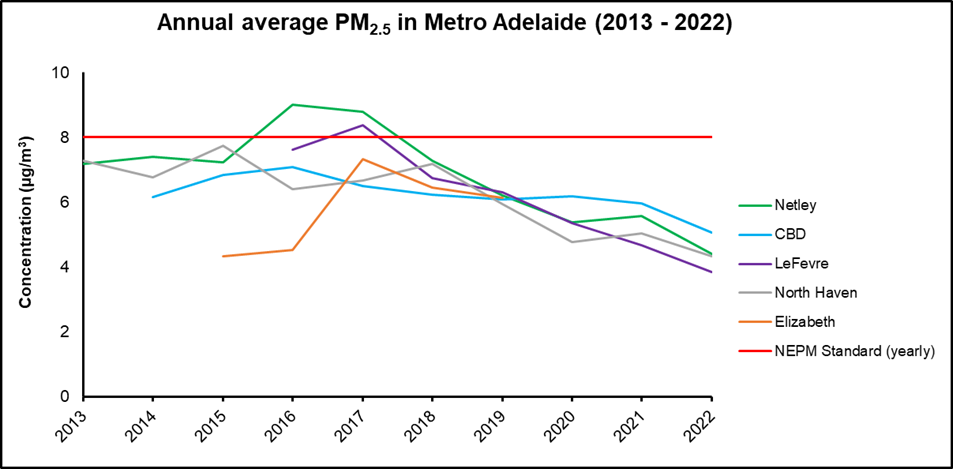
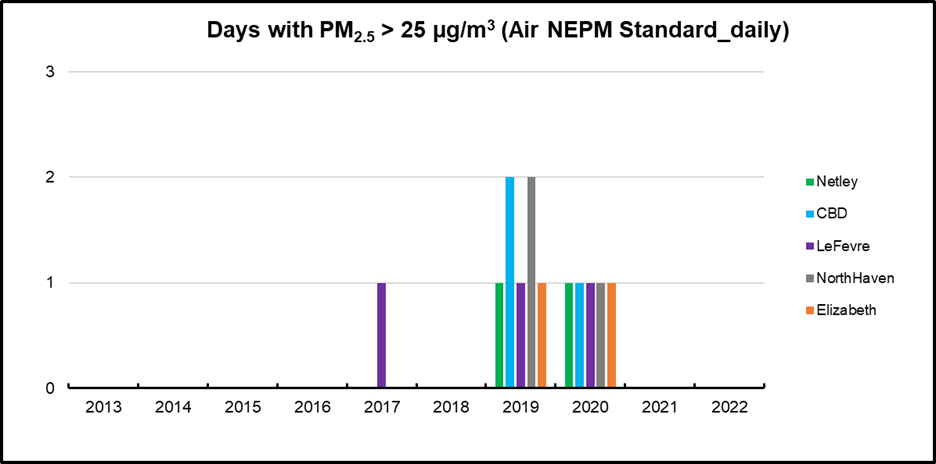
The EPA has five monitoring stations for PM2.5 particles located in metropolitan Adelaide. PM2.5 particle levels are generally on the decline, which is mainly attributed to improvements in fuel quality, motor vehicle engine, pollution control technologies, product standards (for example, wood heaters) and a decrease in manufacturing. The occasional annual rise in PM2.5 averages can be linked to other contributors such as smoke from planned burning and bushfires. The national standard of 8 μg/m3 was met at all locations since 2018.
The 2019-20 bushfires resulted in exceedances of daily average PM2.5 above the national standard of 25 μg/m3.
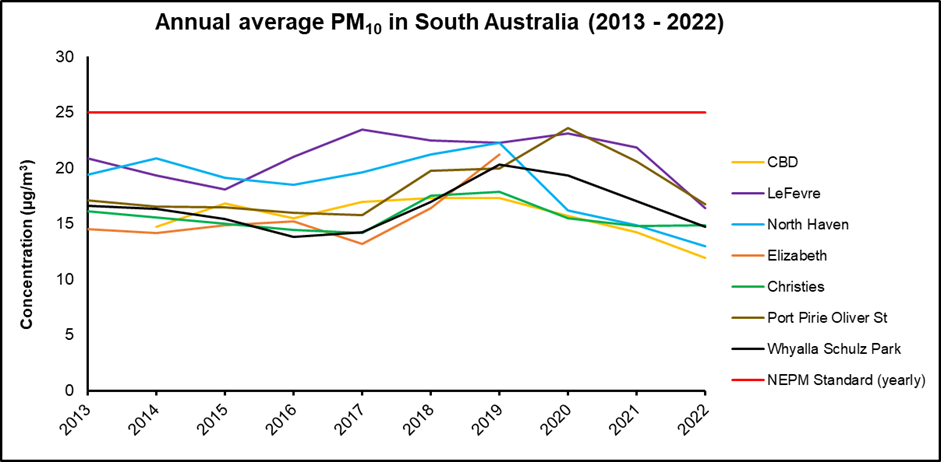
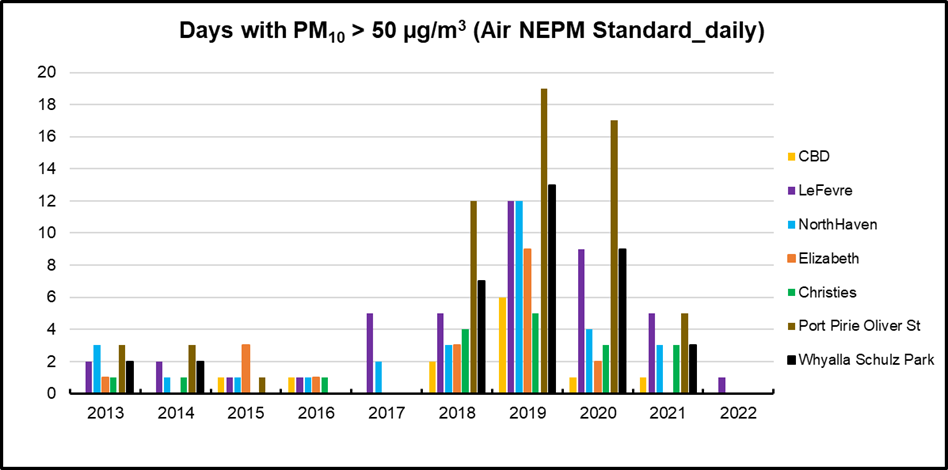
PM₁₀ are small enough to be inhaled into the lungs, and finer ones can even enter the bloodstream. Both short-term and long-term exposure to particles can have health impacts, which may include premature death, aggravation of cardiovascular and respiratory diseases, and cancer. Particle pollution can also affect ecosystems, agriculture and visibility. Areas such as Whyalla, Port Pirie and Port Adelaide, which have industries that contribute to PM10 particulate pollution, continue to be monitored in relation to licence conditions, to ensure continual improvements to minimise pollution.
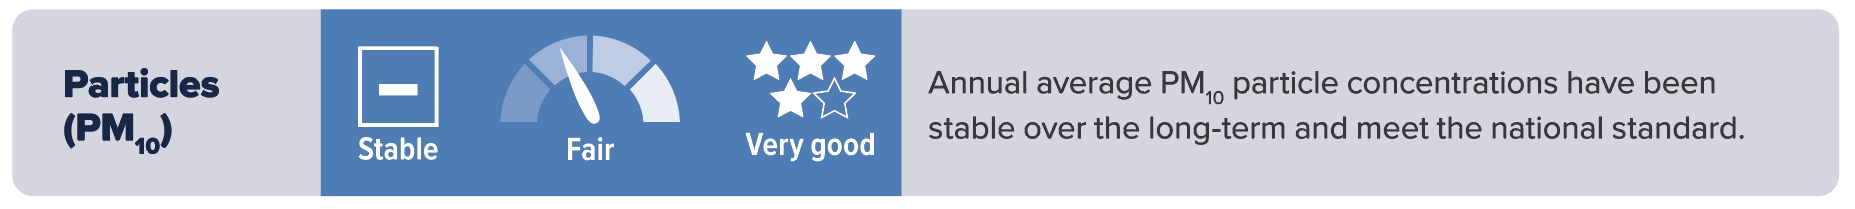
Between 2007 and 2017, ambient levels of PM10 particles either reduced or remained stable. Since then, the level of PM10 particles has increased, most likely from the effects of below average rainfall and drier conditions that were experienced across much of South Australia during 2018 and 2019. Levels of PM10 measured at sites in Port Pirie and Whyalla were generally higher than those measured at sites in the Adelaide metropolitan area in 2021. The national standard of 25 μg/m3 was met at all sites.
Nitrogen Dioxide
Nitrogen dioxide is a highly reactive gas emitted from motor vehicles, industry, gas heaters and gas stovetops. NO2 can irritate airways and trigger or aggravate respiratory diseases. The NEPM standard for NO2 is 0.120 parts per million (ppm) as a 1-hour average. Recent studies have suggested that health impacts from NO2 exposure can occur at levels 3–5 times lower than the NEPM limit.
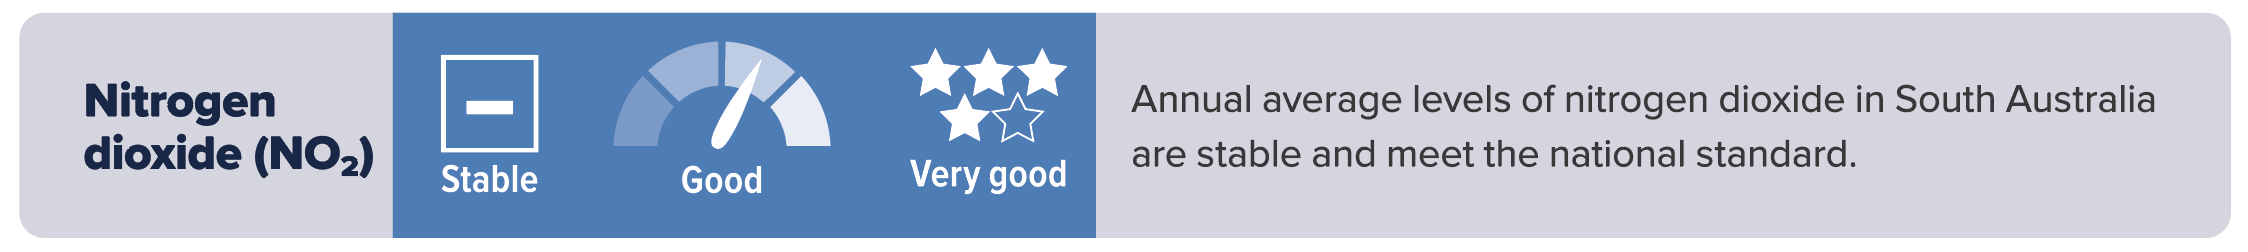
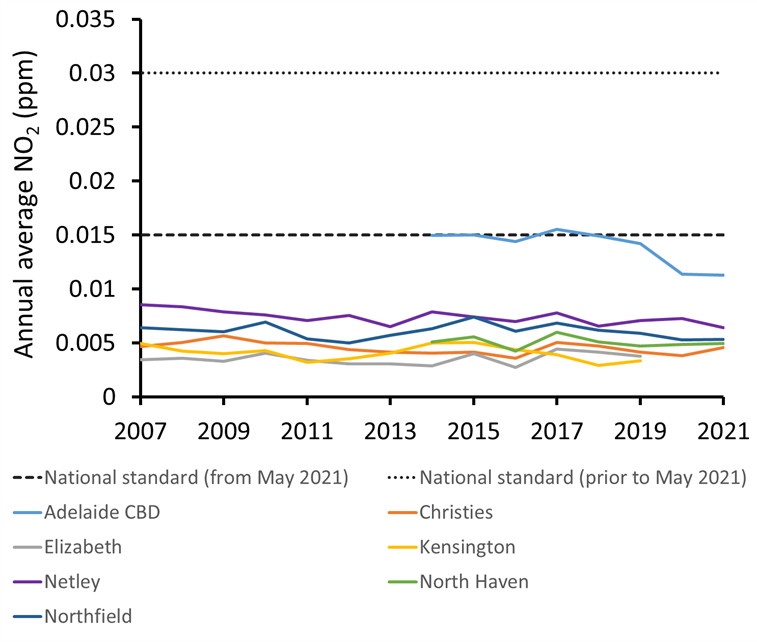
Vehicles, industries that burn fossil fuels and wood burning are common sources of NO2. Levels of NO2 in our air have been stable since 2007 at most sites and are below national standards. Nitrogen dioxide levels measured at the Adelaide CBD station tend to be higher than at other sites due to the station’s proximity to roads and traffic emissions. Australian standards were strengthened in 2021 to reflect current health knowledge.
Current monitoring of NO2 is focused within metropolitan Adelaide, as previous monitoring in other locations such as Gawler, Mount Gambier, Port Pirie, and Whyalla showed lower levels than metropolitan Adelaide.
Sulfur Dioxide
Sulfur dioxide is produced by burning fossil fuels and smelting mineral ores. Atmospheric SO2 affects the respiratory system, can form fine particles and is the primary source of acid rain. The NEPM air quality limit for SO2 is 0.2 ppm as a 1-hour average (there are also 24-hour and annual NEPM limits).
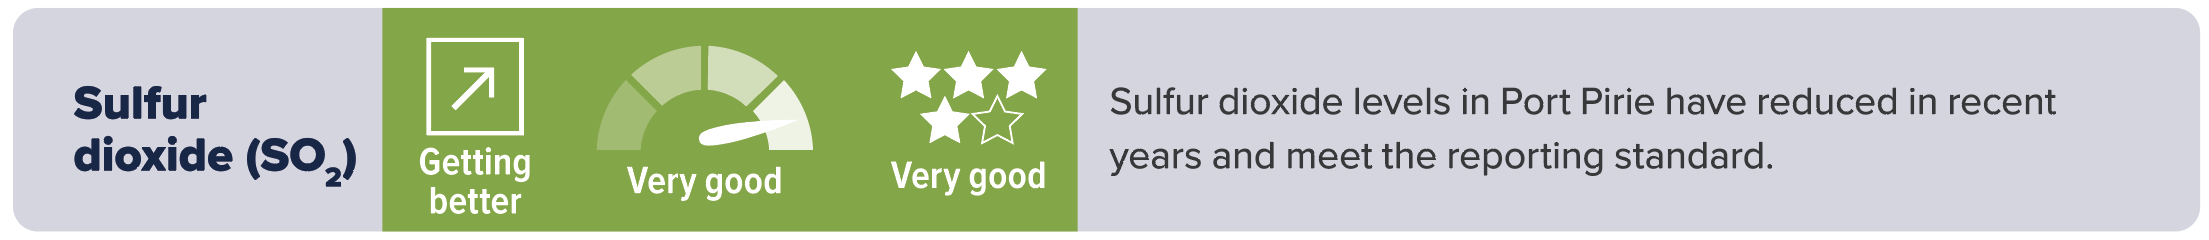
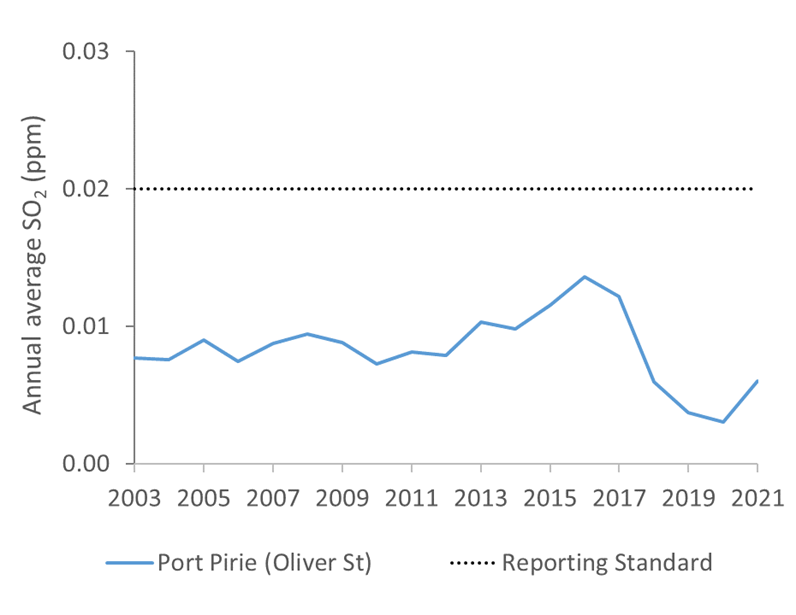
Sulfur dioxide monitoring is currently focused in Port Pirie where there are emissions from the Port Pirie smelter. Annual average levels of SO2 have been variable at the Port Pirie Oliver Street air quality monitoring station over the assessment period (2007 to 2021), but have generally decreased since 2016. Improvements in recent years are the result of new technology that was installed at the smelter as part of the Port Pirie Smelter Transformation Project.
Ground Level Ozone
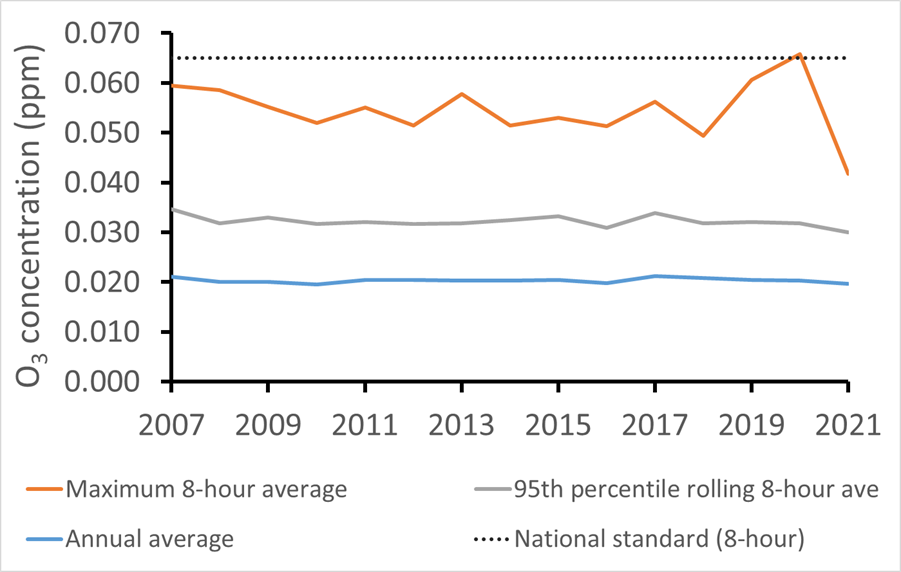
Ground-level ozone is a secondary pollutant and is formed by chemical reactions between nitrogen oxides and volatile organic compounds (VOCs) with warm and sunny weather. Sources of nitrogen oxides and VOCs include emissions from vehicles and industries, burning of fossil fuels and smoke.
Monitoring within the Metropolitan Adelaide has demonstrated that concentrations of ground-level ozone (O3) have remained stable since 2007 and below the national standard. This standard was updated in 2021 to reflect the latest knowledge about health impacts from air pollution. Significant emission events such as bushfires can lead to higher-than-normal levels of O3 as occurred in the summer of 2019-20. Ozone has a naturally occurring background concentration of around 0.015 ppm.