Causes of Climate Change
Human activities are the biggest driver impacting climate change. We are responsible for the emission of greenhouse gases that cause climate change. In addition, we alter our environment, for example, clearing vegetation from land, and impacting wetlands and mangrove areas and losing seagrass from pollution, which then reduces the capacity of our environment to absorb carbon. We need to be responsible for addressing this and reducing the amount of greenhouse gases that reach the atmosphere, particularly with an increasing population.
Greenhouse gases refer to those gases in the earth’s atmosphere that trap and sustain heat. They include:
- Carbon dioxide (CO2), which is produced from burning fossil fuels (for example, transport, electricity and some industries) and other solid matter (for example, wood), and is the primary source of greenhouse gas emissions. While carbon dioxide is naturally present in the atmosphere as part of the carbon cycle, human production of carbon dioxide is impacting the balance of carbon sequestration by natural sinks, such as soils, plants and oceans that absorb carbon dioxide.
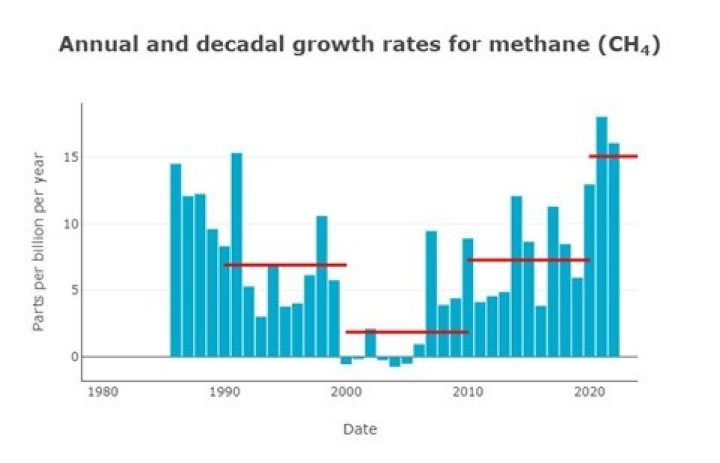
- Methane (CH4), which is emitted from livestock production, fossil fuel extraction and use, landfill waste and wetlands. Although less methane is emitted to the atmosphere compared with carbon dioxide and remains in the atmosphere for a shorter period of time, its global warming potential is 86 times higher than CO2 when averaged over 20 years and 28 times higher over 100 years.
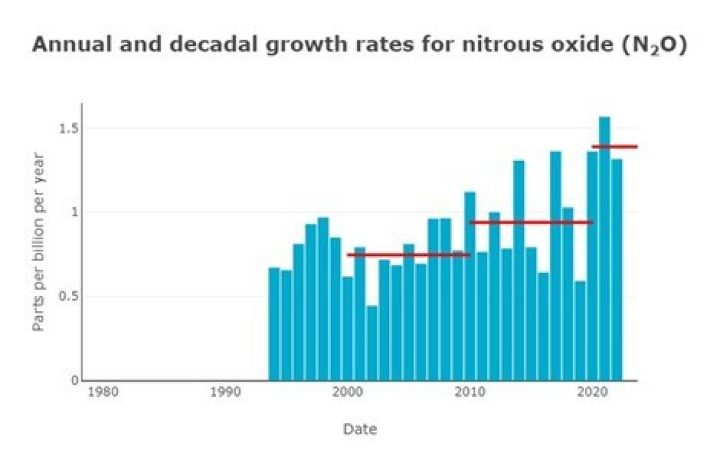
- Nitrous oxide (N2O), which is emitted during agricultural land use, burning of fossil fuels and solid matter, and the treatment of wastewater. Nitrous oxide is 300 times stronger than CO2.
- Fluorinated gases, which are emitted from a variety of household, commercial and industrial applications and processes.
Greenhouse gases are necessary for warming the earth’s atmosphere. Without this, life on earth would not exist as it would be too cold. However, producing excess greenhouse gases and clearing vegetation has upset the balance between absorbing and releasing gases, resulting in an increase of gases in the atmosphere. This has ultimately led to more heat being trapped in the atmosphere and the rise in temperatures.
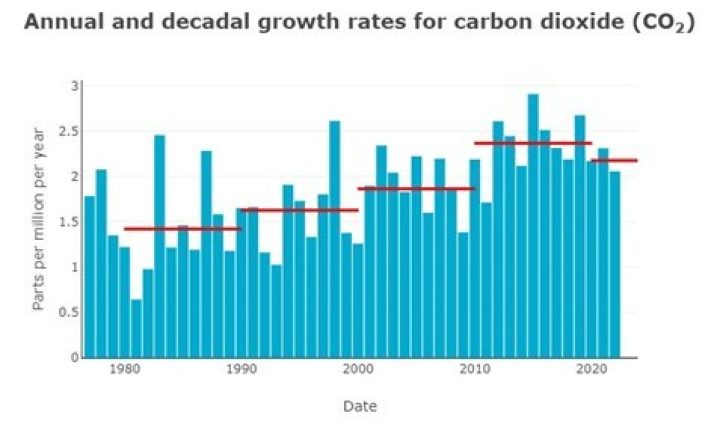
Greenhouse gases are monitored by the Kennaook/Cape Grim baseline air pollution station, located in Tasmania, as part of the World Meteorological Organisation Global Atmosphere Watch Program. Results have shown that there has been a steady increase in greenhouse gases in the atmosphere. This is mainly from fossil fuel consumption and various agricultural practices. Carbon dioxide does appear to have dropped slightly at the beginning of the 2020 decade, potentially due to COVID-19 and the reduction in transport during this time.
The graphs below show the greenhouse gases concentrations measured at the Kennaook/Cape Grim Baseline Air Pollution Station, Tasmania (CSIRO).
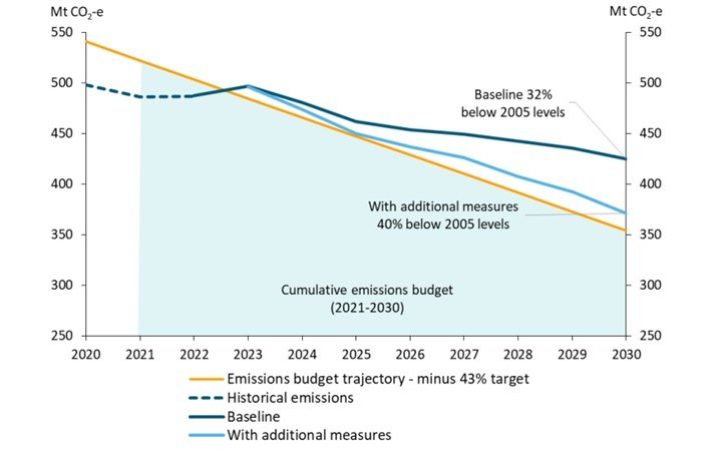
The Australian Government has entered the Paris Agreement, which is a legally binding international treaty on climate change. Its ultimate goal is to limit the increase of global temperatures to below 2ºC above pre-industrial levels, with an aim to limit it to 1.5ºC. There have been 195 countries that have signed up and are required to submit national climate action plans known as Nationally Determined Contributions (NDC). Australia’s NDC commits us to reducing greenhouse gas emissions to 43% below 2005 levels by 2030 and achieving zero emissions by 2050. According to the 2022 emissions projections report for Australia, we are progressing on achieving this target, but we are falling a little short. Most of this reduction will be achieved via further investment in renewable energy.
Australia’s net greenhouse gas emissions are reported in accordance with the United Nations Framework Convention on Climate Change. According to the 2021 report:
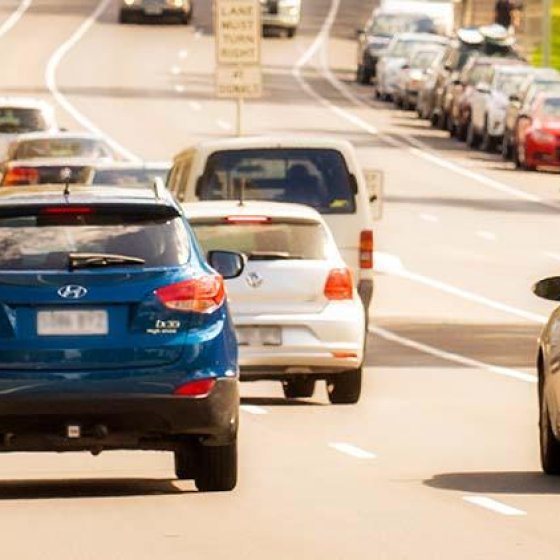
- The energy sector is the biggest emitter of greenhouse gases in Australia. This sector includes transport and electricity generation and consumption. Industries, agriculture and the waste sector also generate greenhouse gas emissions.
- Land use, land use change and forestry have changed from a net source of greenhouse gases to a net sink since 2015–16.
- In Australia, there has been a downward trend of greenhouse gas emissions since 2006–07.

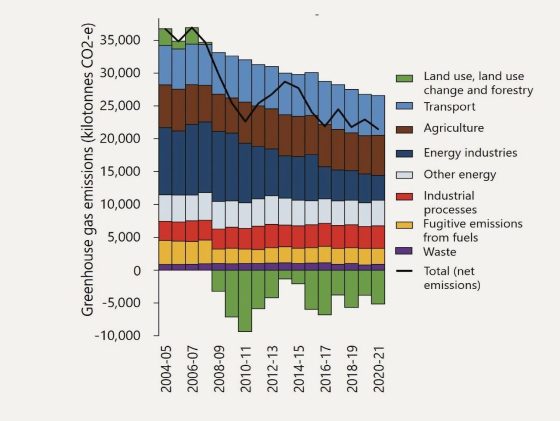
South Australia’s greenhouse gas emissions (carbon dioxide equivalents/MtCO2-e) have decreased by 42% from 2004–05 to 2020–21. In 2020–21, South Australia’s greenhouse gas emissions were 11.9 tonnes per capita, the third lowest compared with other Australian states and territories on a per capita basis.
Greenhouse gas emissions are from various sources. Transport is currently the highest source of emissions followed by agriculture. Emissions from the energy sector have declined significantly, most likely due to South Australia’s investment in renewable energy. Since 2008–09 to 2020–21, net emissions from land use and forestry have been negative, that is, more carbon has been sequestered than released.
The South Australian Government has a target to reduce the state's net greenhouse gas emissions by more than 50% below 2005 levels by 2030, and to achieve net zero emissions by 2050. The state is making good progress towards achieving this target.
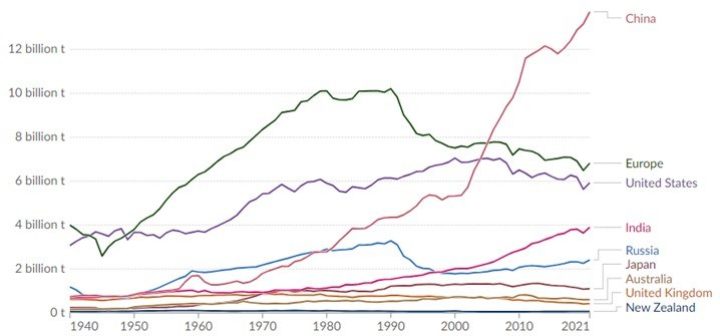
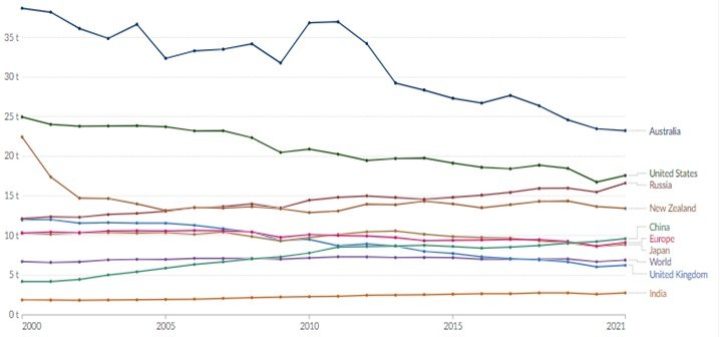
Globally, the countries with the highest greenhouse gas emissions are China, United States of America, Europe and India. Per capita though, Australia is one of the highest emitters of carbon dioxide emissions from fossil fuels and industry. Global energy related carbon dioxide emissions increased by 0.9% in 2022.