Seas
Our oceans are experiencing the brunt of climate change, with increases in sea surface temperatures, rising sea levels and ocean acidification.
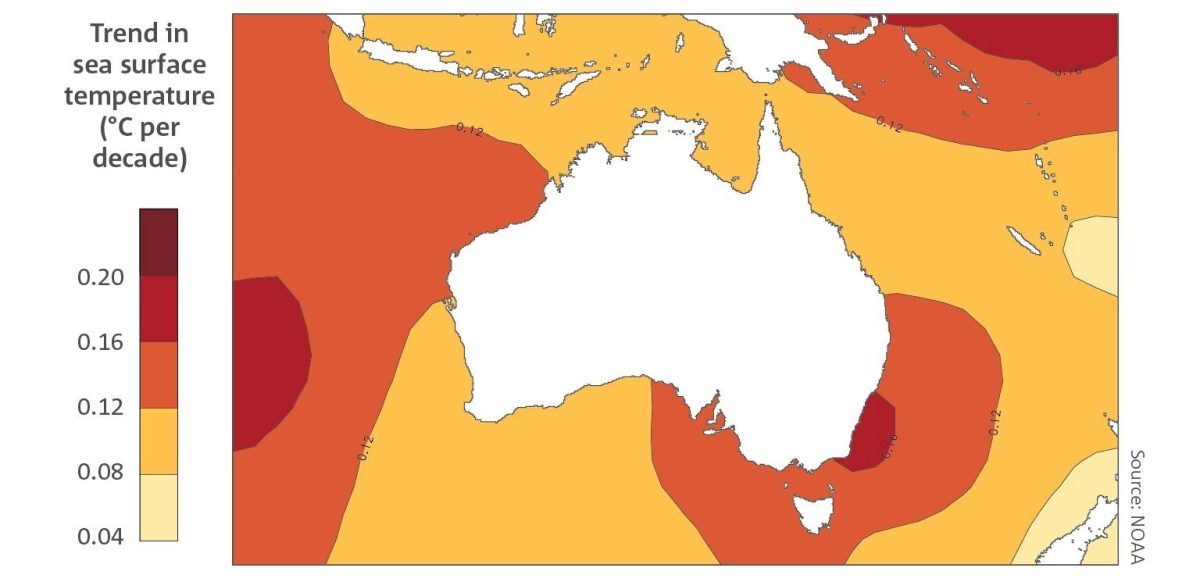
Sea Temperature
The annual 2022 sea surface temperature anomaly for the Australian region was the highest on record, reaching 0.80°C above the 1961–1990 average. Since 1900, the average sea surface temperature has risen by 1.05°C with 8 out of 10 of the warmest years on record occurring since 2010. Rising sea surface temperatures impact marine ecosystems (including seagrasses) and biodiversity, increase the risk of harmful algal blooms and fish kills, and can cause a poleward shift in species distribution. It may also result in adverse impacts to our fisheries, aquaculture and tourism industries resulting from warmer waters and lower oxygen levels, and increase the prevalence of invasive species that are more tolerant of temperature changes.
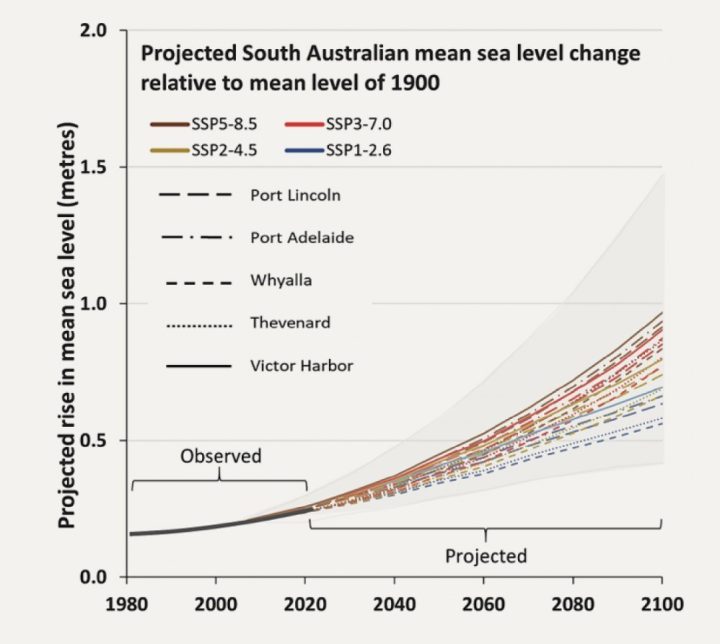
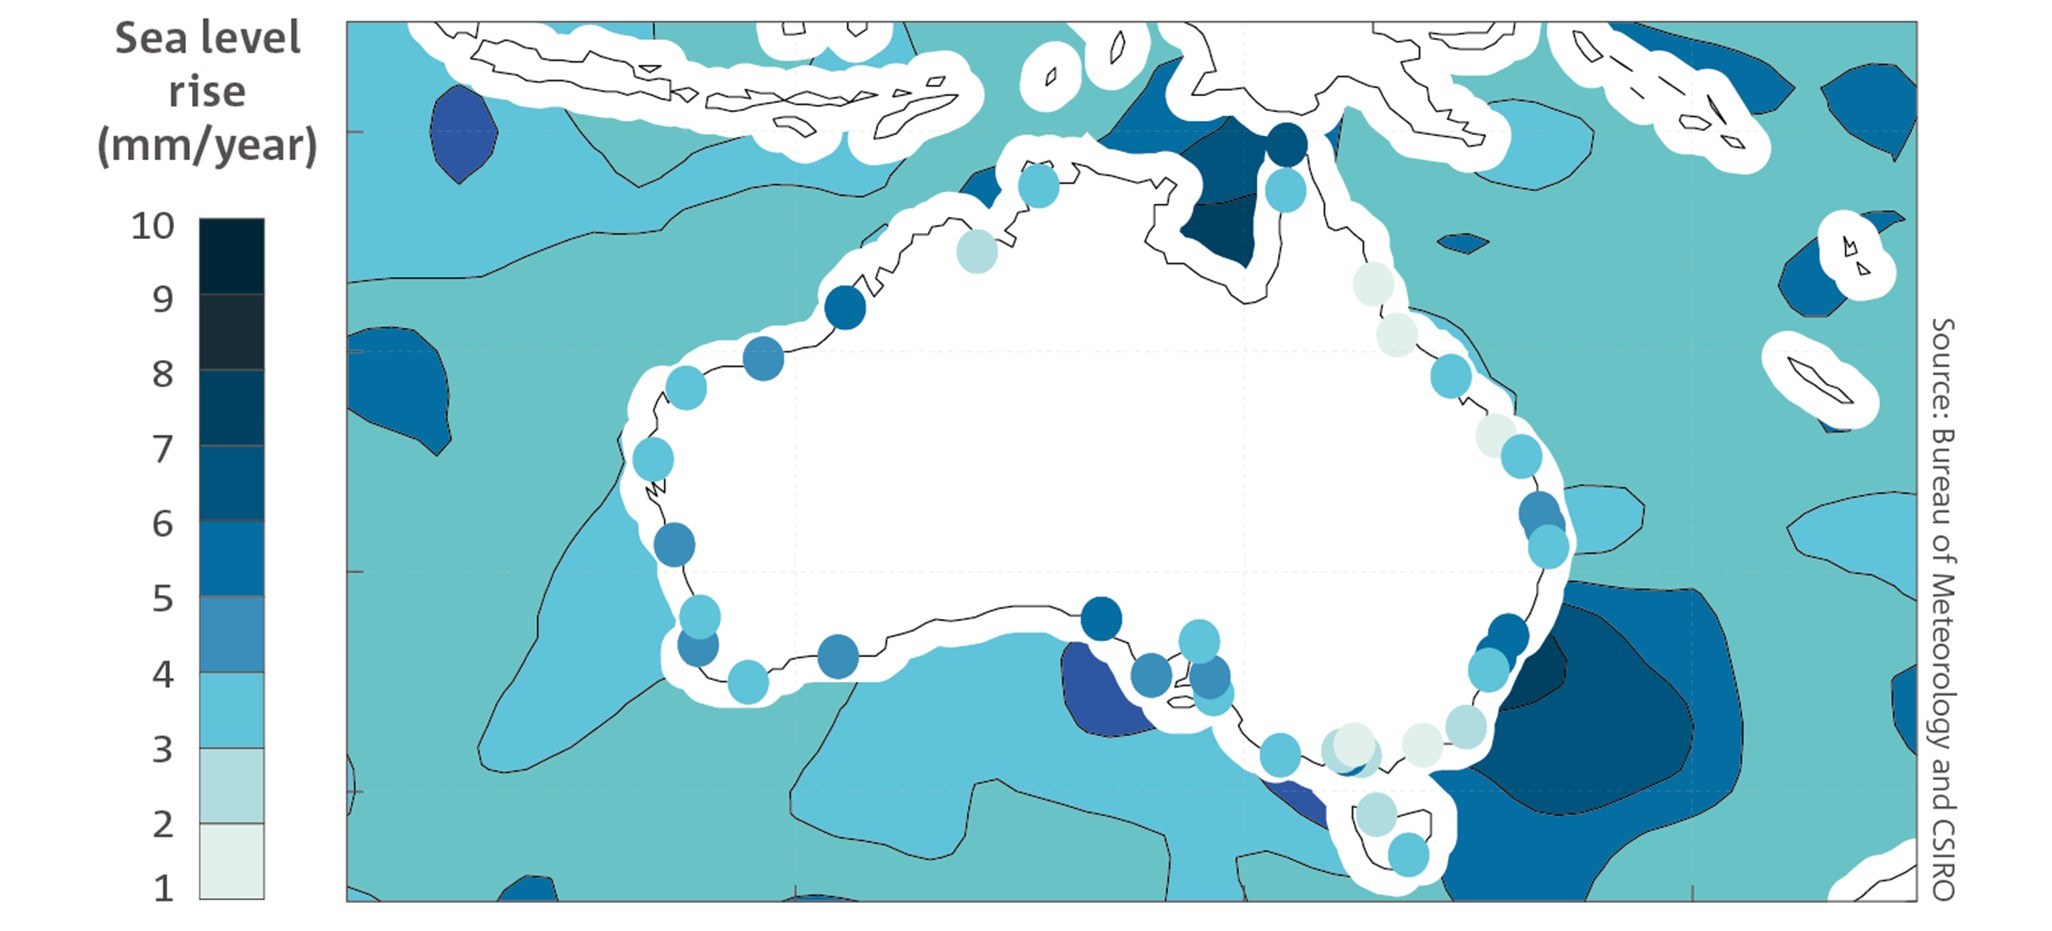
Sea Level

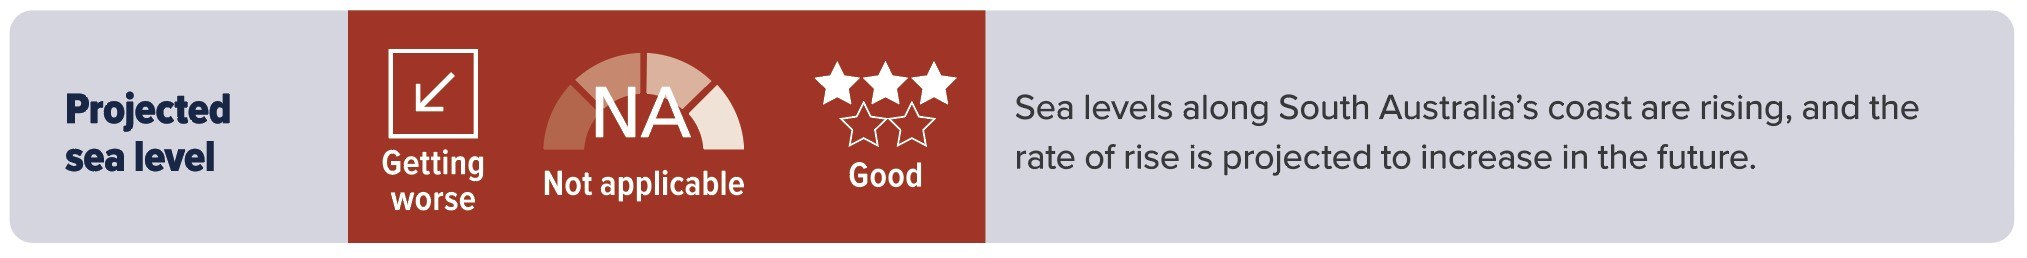
Sea levels along the South Australian coast have risen by an average rate of 2 mm per year from 1966 to 2022. The rate of sea-level rise is increasing, and from 1993 to 2022 was between 3 mm and 5 mm per year in some locations. Mean sea levels measured at tide gauges located at Port Adelaide, Thevenard and Victor Harbor have increased by 10–12 cm from 1965–69 to 2017–21. The rate of rise is projected to increase in the future under plausible emissions scenarios.
Mean global sea-level rise is also accelerating and has risen by around 25 cm since 1880. Half of this rise has occurred since 1970. This has been caused by the thermal expansion of water as sea surface temperature increases and melting of polar ice sheets. Australia is also experiencing rises in sea levels, with impacts such as storm surges, coastal inundation and erosion already being observed.
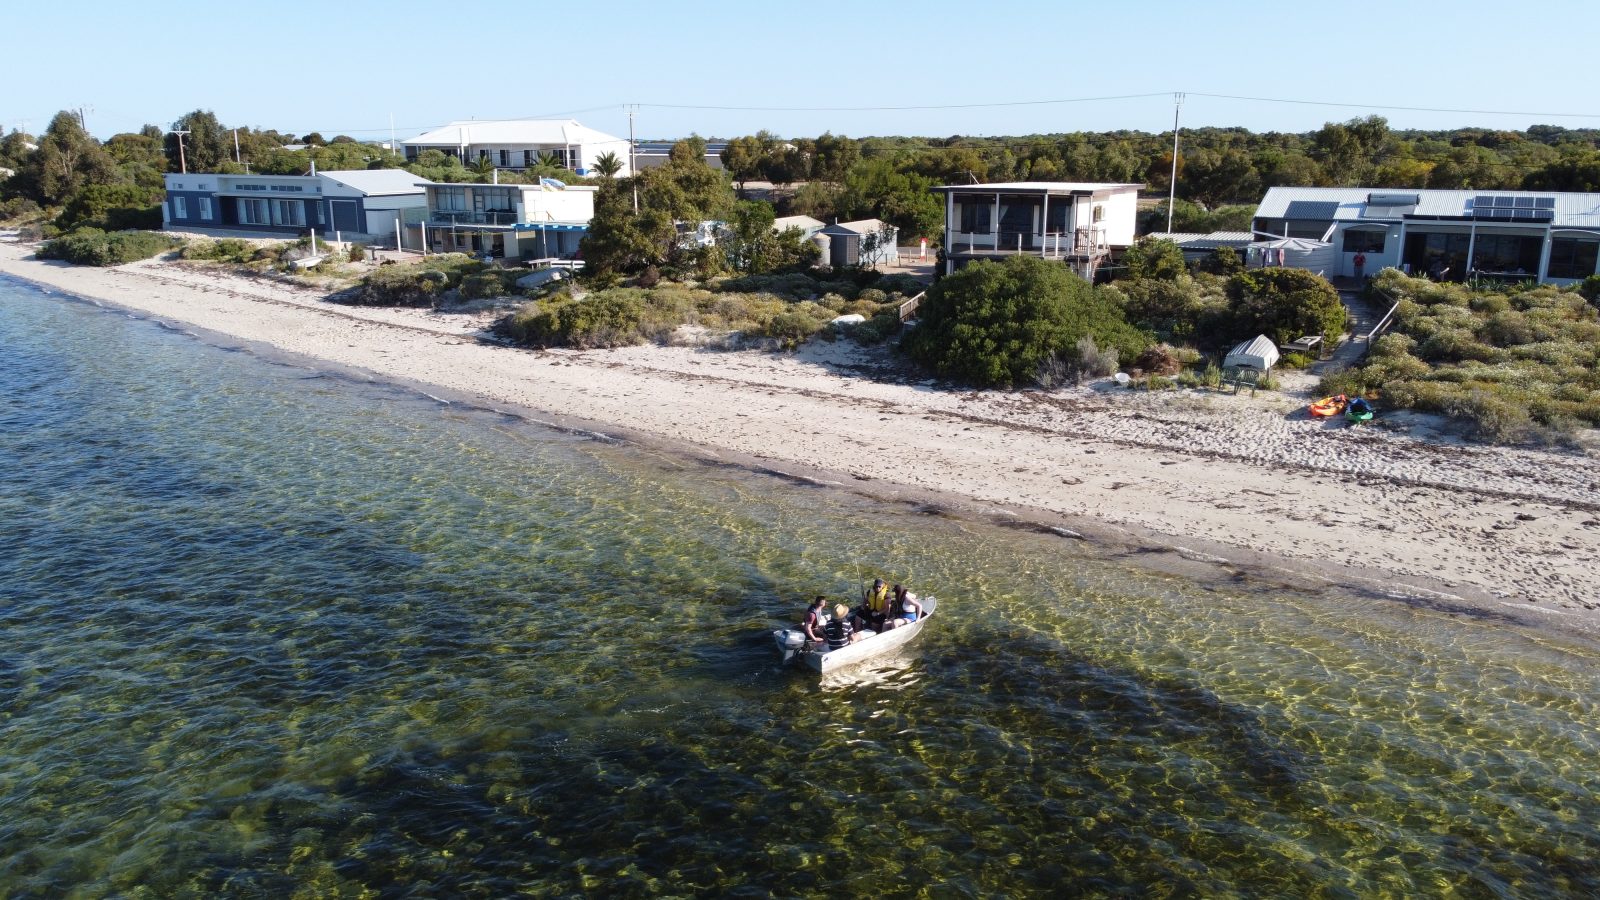
Rising sea levels will increase erosion and result in damage to residential and commercial properties and other infrastructure from inundation of sea water and storm surges. A 2009 report by the Australian Government titled: Climate Change Risks to Australia’s Coast estimates that between 25,000 and 43,000 residential buildings may be at risk of flooding. Of the 68 councils in South Australia, 34 have coastal management responsibilities. The Local Government Association will be working with a number of government agencies and stakeholders to deliver an SA Climate Ready Coasts program. This program will aim to facilitate consistent approaches to coastal adaptation across South Australia and improve our knowledge and capacity to address adaptation for coastal planning. The Program Plan was issued in March 2023. Coastal flood mapping has been undertaken to identify areas that may be susceptible to sea-level rise and storm events.
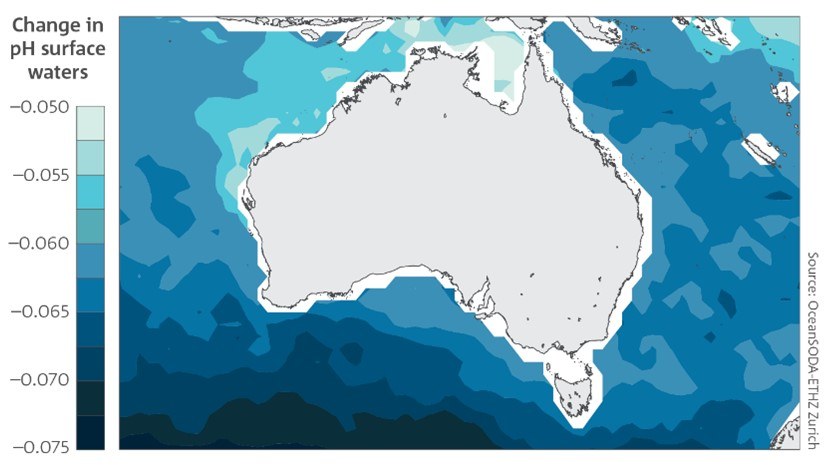
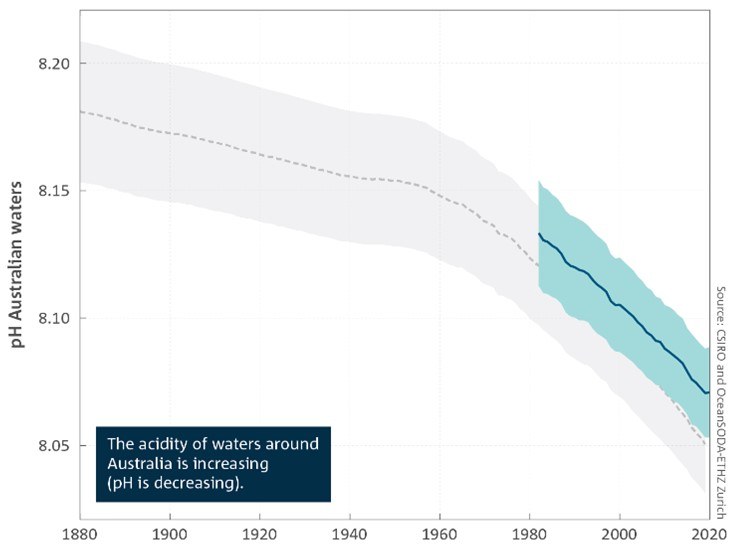
Ocean Acidity
The pH of our oceans is also decreasing as a result of increased carbon dioxide in the atmosphere. Since the 1880s, the pH of oceans has decreased by around 0.12, which corresponds to around a 30% increase in acidity. A decreasing pH places further challenges on marine ecosystems, including the growth and physiology of plants and animals, and has significant impacts on those animals that have shells and external skeletons that comprise calcium carbonate.
The figures below show the estimated pH in surface waters around Australia.
More Information on the impact of Climate change can be found in:
Further Reading
- Coast Adapt – Provides information and guidance on the impact of climate change on Australia’s coastal regions.
- Local Government Coastal Adaptation Guidelines – Provides guidance to South Australian councils for assessing and quantifying the likely impacts to coastal councils from coastal inundation and erosion as a result of climate change.
- State of the Climate 2022: Oceans – Contains data and information on impacts climate change is having on Australia’s oceans.
- Marine Heatwaves International Working Group – Provides information about an international group of scientists working together to examine physical drivers of marine heatwaves, as well as their properties, predictability and socio-ecological impacts.